



Being overweight or obese is often thought of as a modern health problem, but scientists have compared weight with height for almost 200 years. In 1835, Adolphe Quetelet noticed that adult weight rises roughly with the square of height, the rule behind today’s body mass index (6).
The Ponderal Index (PI) is another way to compare weight with height. It divides by height cubed instead of squared, and researchers have tested it as an alternative to body mass index (BMI), the far more widely used ratio (1).
In this article, we explain what the Ponderal Index is, how it’s calculated, what your result means, and where it falls short.
Ponderal Index Calculator
Example: 5 ft 10 in, 180 lb
14.53kg/m³
Your ponderal index is 14.53 kg per cubic meter.
Enter your own numbers above to replace this example.
Height
5 ft 10 in
Weight
180 lb
- Next stepBMI calculatorThe weight for height measure with published health bands.
Formula: PI = kg / m ^ 3, Rohrer's index.
You get your PI as a number. If you are an adult, read it against the chart in What Do the Results Mean? below.
What is the Ponderal Index, and How is it Calculated?
The Ponderal Index compares your weight with your height. Its name comes from the Italian anthropologist Livi, who in 1897 called the cube root of weight divided by height the ponderal index. Rohrer’s version, weight divided by height cubed, followed in the early 1900s. This calculator uses Rohrer’s formula. PI is also known as Rohrer’s Index or the Corpulence Index (6).
The Ponderal Index is very similar to Body Mass Index. The difference is the power of height: BMI divides your weight by your height squared, and PI divides it by your height cubed.
BMI is calculated like this:
- BMI = weight (kg) / height (m)²
Whereas PI is calculated like this:
- PI = weight (kg) / height (m)³
So BMI comes out in kg/m² and PI in kg/m³. Because PI divides by your height one more time, your PI equals your BMI divided by your height in meters.
Work out your BMI too and compare it with your PI to see what that extra division by height does to your score.
In a 1970 paper, Florey used data from the Framingham Study to compare three weight-for-height ratios: weight divided by height, BMI and PI. Florey judged them on independence from height: a good ratio should not rise or fall with a person’s height alone. By that measure, PI was the least likely of the three to turn out the best ratio, for men and for women. BMI was the most likely for men, and weight divided by height was probably the best for women (1).
Neither PI nor BMI measures your body composition, meaning how much of your weight is fat. Florey found all three ratios poor measures of body fat (1).
How to Use the Ponderal Index (PI) Calculator
Our Ponderal Index calculator is very straightforward to use. Just follow these step-by-step instructions:
- Select your preferred units: imperial (feet, inches, and pounds) or metric (meters, centimeters, and kilograms).
- Choose Adult or Newborn. Newborn is for a baby at birth: enter the length and the birth weight in grams. Everyone else, older children and teens included, uses Adult.
- Enter the height (or length) and the weight. Be as accurate as you can.
- Hit Calculate.
What Do the Results Mean?
Adults: read the chart below as a first guide, then check it against your own height as explained beneath it. Newborn scores use a different scale, covered at the end of this section.
| PI (kg/m³) | Classification |
| Below 11 | Underweight |
| 11 to under 15 | Normal weight |
| 15 to under 18 | Overweight |
| 18 and over | Obese |
This chart is FitnessVolt’s guide. We could not find a health authority that grades adult PI, so we built the chart from the World Health Organization’s grades for BMI: underweight below 18.5, overweight from 25 and obesity from 30 (7). We divided each of those cut-offs by 1.68 m (5 ft 6 in), halfway between the average height of US men (5 ft 9 in) and US women (5 ft 3.5 in) (8), and rounded to the nearest whole number.
Because your PI is your BMI divided by your height, the chart lines up with the WHO grades only at about 1.68 m. At the same BMI, a taller person scores a lower PI and a shorter person a higher one, the height problem Florey found (1). For a reading that fits your own height, multiply your PI by your height in meters. The answer is your BMI, which you can check against the WHO cut-offs above: a PI of 14.5 at 1.80 m, for example, sits in the chart’s normal band but is a BMI of 26.1, overweight by the WHO grades.
The NIDDK, part of the US National Institutes of Health, lists these health risks of overweight and obesity, and says they are higher if you carry extra fat around your waist (2). Check the list if the chart, or the BMI check above, puts you in the overweight or obese range:
- Type 2 diabetes
- High blood pressure
- Heart disease and stroke
- Metabolic syndrome
- Fatty liver diseases
- Some cancers: colon, rectum and prostate cancer in men; breast, uterine lining and gallbladder cancer in women
- Sleep apnea and other breathing problems
- Osteoarthritis and gout
- Gallbladder, pancreas and kidney diseases
- Problems during pregnancy
For a baby at birth, the Newborn setting gives the newborn ponderal index, 100 × birth weight in grams ÷ (length in centimeters)³. In a national study of Chinese newborns, babies born at 37 to 42 weeks usually scored between about 2.1 and 3.1 (3). Older children and teens use the Adult setting, but the chart above is for adults only, so ask a pediatrician how a child’s result compares with their growth charts.
Factors Affecting Ponderal Index
While PI compares your weight to your height, it does not account for what your weight is made up of, which is your body composition. For example, you could weigh 200 pounds with 8% body fat or weigh the same 200 pounds with a body fat percentage of 35%.
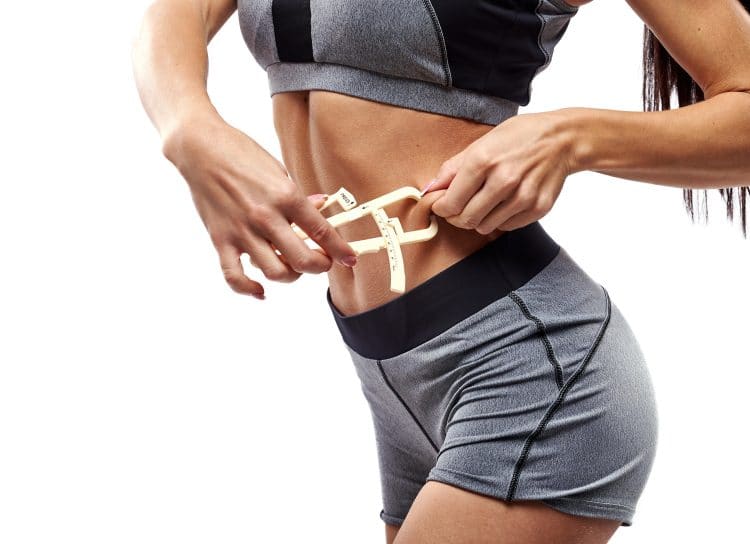
Those two versions of you would look very different, and the extra fat, especially around the waist, carries the health risks listed above (2). Yet your Ponderal Index would be the same.
So PI can mislabel people who train. A lean bodybuilder, a powerlifter or anyone who lifts weights for fun can score as overweight or obese while carrying little fat.
At the other end, a slim endurance athlete can land in the underweight band.
Your bodyweight is also affected by how much water you’re carrying, i.e., your hydration levels. For example, a liter of water weighs one kilo or about 2.2 pounds, so all you need to do is pee or sweat a lot to lower your Ponderal Index. At 1.68 m, each liter you lose takes about 0.2 off your PI.
However, losing water weight won’t change your body composition (body fat percentage). As an exerciser, your hydration levels probably fluctuate throughout the day, and your PI moves with them.
So, in summary, if you are more muscular than average, holding a lot of water or shorter than average, your Ponderal Index score will be higher. This result may suggest that you are overweight, even when you are not.
While there is nothing to stop you from using the Ponderal Index to track your progress, you should not worry too much if you get a higher-than-expected score. Provided you are not overly fat, your high result probably comes from muscle or from being shorter than average.
For that reason, most exercisers should rely on assessments that estimate body fat percentage rather than height-to-weight comparisons like PI and BMI.
How to Improve Your Ponderal Index Score
If you are lean and muscular, the only way to lower your Ponderal Index score would be to lose muscle mass. Muscle is hard to build, and you probably don’t want to lose it. So, if you aren’t overly fat, there is no reason to try and improve your PI score. Just accept that calculations that compare height to weight often discriminate against muscular exercisers.
That said, if you know you are carrying excess body fat, you can improve your Ponderal Index by getting leaner and losing weight.
Strategies for achieving this goal include:
1. Create a calorie deficit
Body fat is mostly stored energy. When you eat more calories than you burn, your body saves much of the excess as fat for later.

To burn off unwanted body fat, you need to take in fewer calories than you burn. This is called a negative energy balance or calorie deficit, and US obesity guidelines say weight loss requires one (9). Faced with the shortfall, your body draws on its energy stores, body fat included.
You could just eat less and hope that you create a calorie deficit, but a daily calorie target takes out the guesswork.
Determine your Total Daily Energy Expenditure using our TDEE calculator and subtract 500 from your result. That is your daily calorie target. It gives you a deficit of 500 calories a day, one of the options in the US guidelines, which also list 750 (9). Track your food intake so you actually eat that amount.
2. Increase your daily energy expenditure
While eating less is an essential part of losing weight, you’ll get even better results if you burn more calories a day through exercise and physical activity. In metabolic terms, these things are called the Thermic Effect of Activity (TEA) and Non-Exercise Activity Thermogenesis (NEAT). NEAT is the energy you burn in everything you do that is not sleeping, eating or sports-like exercise, such as walking to work, typing and fidgeting (4).
Small movements count: even trivial activities raise your metabolic rate, and your daily NEAT is the sum of all of them (4). For exercise, the WHO advises adults to get 150 to 300 minutes of moderate activity a week, or 75 to 150 minutes of vigorous activity, and says more is better (10).
3. Eat more protein
While all types of food contain calories, your body also burns calories to digest, absorb and store what you eat, on top of your basal metabolic rate (BMR), which is the number of calories your body burns at rest. This is called the Thermic Effect of Food, or TEF.
Of the three food groups or macros, protein has the highest TEF: your body uses 20 to 30% of the calories in protein to process it, compared with 5 to 10% for carbohydrate and 0 to 3% for fat (5). Eat 500 calories of protein, and about 100 to 150 of them go to processing it. Protein also helps you feel full, partly through that same thermic effect (5).
Use our protein calculator to determine your ideal protein intake.
4. Get more sleep
Short sleep can make you hungrier. In a lab study of 12 young men, two days of restricted sleep raised their hunger by 24% and their appetite for calorie-dense, high-carbohydrate foods by 33 to 45% (11). Over the long term, regularly sleeping less than 7 hours a night is linked with weight gain and obesity (12).
Sleep experts advise adults to get 7 or more hours of sleep per night on a regular basis (12), so weeknights count as much as weekends. In most cases, getting more sleep means going to bed earlier. So, turn off the TV, put down your tablet, and set your phone to airplane mode.
5. Pick a sustainable diet
When it comes to losing weight, there are lots of different diets to choose from. In a one-year trial of the Atkins, Ornish, Weight Watchers and Zone diets, weight loss tracked how closely people stuck to their diet; which diet they followed made no measurable difference (13). So, the trick is to find a diet you can stick to for as long as it takes to reach your weight loss target.
If you hate your diet, you are much less likely to follow it without cheating. In contrast, if you enjoy your meals and snacks, you have no real reason to cheat or quit.
So, rather than choosing the latest celebrity-endorsed diet plan, use your own food preferences to help you choose the best diet for you. Look for a diet you know you’ll be able to follow for the foreseeable future and not one you’ll start to hate within a few days.
Intermittent fasting is one option if skipping meals suits you: you skip breakfast and your mid-morning snack and start eating later in the day. On its own, it does not speed up weight loss: in a 12-week trial, people who ate only between noon and 8 pm lost about the same weight as people who ate three meals a day (14). It helps only if it leads you to eat fewer calories overall.
Read our beginner’s guide to intermittent fasting.
Ponderal Index: Wrapping Up
The Ponderal Index compares your weight with your height and nothing else. It cannot tell muscle from fat or water, and Florey found it a poor measure of body fat (1).
Muscular people can score as overweight while lean, your hydration moves your score, and your height tilts it: at the same BMI, taller people score lower and shorter people higher.
Use our PI calculator as a quick check, then confirm it with your BMI, your waist size or a body fat estimate.
References:
1. PubMed: The use and interpretation of Ponderal Index and other weight-height ratios in epidemiological studies (Florey, Journal of Chronic Diseases, 1970) https://pubmed.ncbi.nlm.nih.gov/5455357/
2. NIDDK, US National Institutes of Health: Health Risks of Overweight & Obesity https://www.niddk.nih.gov/health-information/weight-management/health-risks-overweight
3. PubMed Central: Construction of China national newborn growth standards based on a large low-risk sample (Zong et al., Scientific Reports, 2021) https://pmc.ncbi.nlm.nih.gov/articles/PMC8352878/
4. PubMed: Non-exercise activity thermogenesis (NEAT) (Levine, Best Practice & Research Clinical Endocrinology & Metabolism, 2002) https://pubmed.ncbi.nlm.nih.gov/12468415/
5. PubMed Central: Diet induced thermogenesis (Westerterp, Nutrition & Metabolism, 2004) https://pmc.ncbi.nlm.nih.gov/articles/PMC524030/
6. PubMed Central: Weight/height²: Mathematical overview of the world’s most widely used adiposity index (Heymsfield et al., Obesity Reviews, 2025) https://pmc.ncbi.nlm.nih.gov/articles/PMC11611441/
7. World Health Organization: Body mass index (BMI), Global Health Observatory https://www.who.int/data/gho/data/themes/topics/topic-details/GHO/body-mass-index
8. CDC National Center for Health Statistics: FastStats: Body Measurements (US adults 20 and older, August 2021 to August 2023) https://www.cdc.gov/nchs/fastats/body-measurements.htm
9. PubMed Central: 2013 AHA/ACC/TOS guideline for the management of overweight and obesity in adults (Jensen et al., Circulation, 2014) https://pmc.ncbi.nlm.nih.gov/articles/PMC5819889/
10. PubMed Central: World Health Organization 2020 guidelines on physical activity and sedentary behaviour (Bull et al., British Journal of Sports Medicine, 2020) https://pmc.ncbi.nlm.nih.gov/articles/PMC7719906/
11. PubMed: Sleep curtailment in healthy young men is associated with decreased leptin levels, elevated ghrelin levels, and increased hunger and appetite (Spiegel et al., Annals of Internal Medicine, 2004) https://pubmed.ncbi.nlm.nih.gov/15583226/
12. PubMed Central: Recommended amount of sleep for a healthy adult: a joint consensus statement of the American Academy of Sleep Medicine and Sleep Research Society (Watson et al., Journal of Clinical Sleep Medicine, 2015) https://pmc.ncbi.nlm.nih.gov/articles/PMC4442216/
13. PubMed: Comparison of the Atkins, Ornish, Weight Watchers, and Zone diets for weight loss and heart disease risk reduction: a randomized trial (Dansinger et al., JAMA, 2005) https://pubmed.ncbi.nlm.nih.gov/15632335/
14. PubMed Central: Effects of time-restricted eating on weight loss and other metabolic parameters in women and men with overweight and obesity: the TREAT randomized clinical trial (Lowe et al., JAMA Internal Medicine, 2020) https://pmc.ncbi.nlm.nih.gov/articles/PMC7522780/